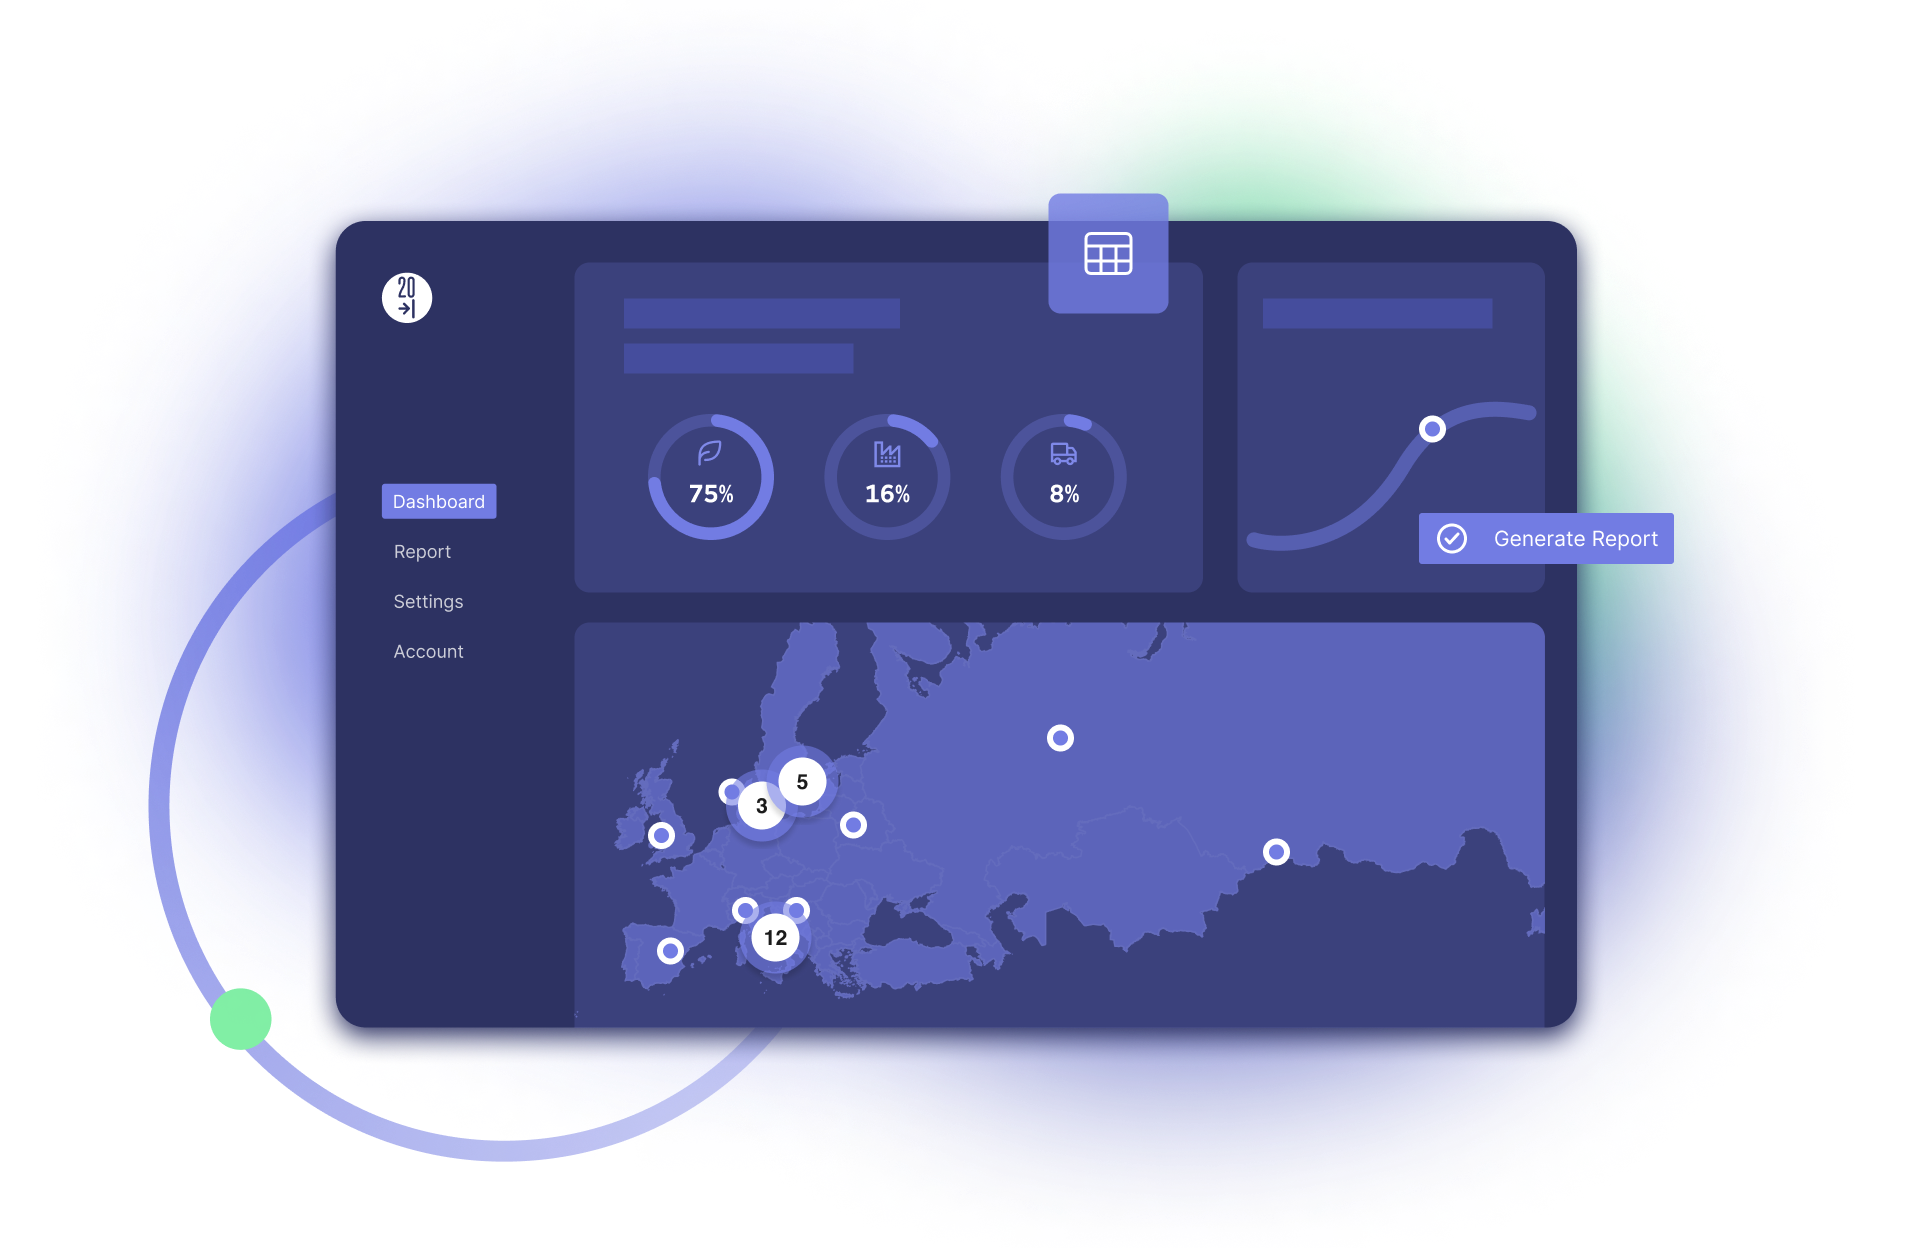
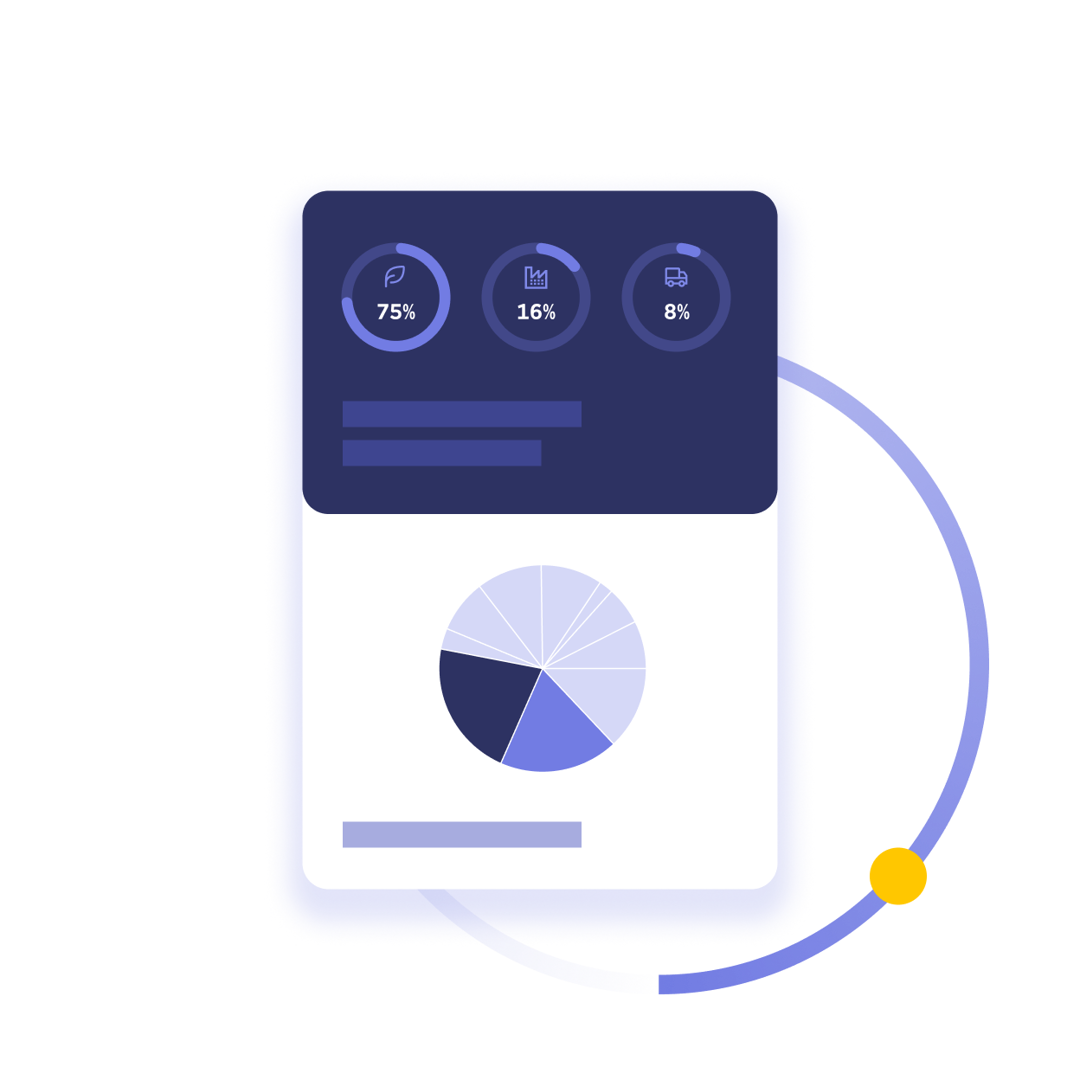
Dynamic Charting: Real-Time Insights
Create dynamic charts that adapt to your data, providing real-time insights and trend analysis.
Visualize Data, improve Decision-Making
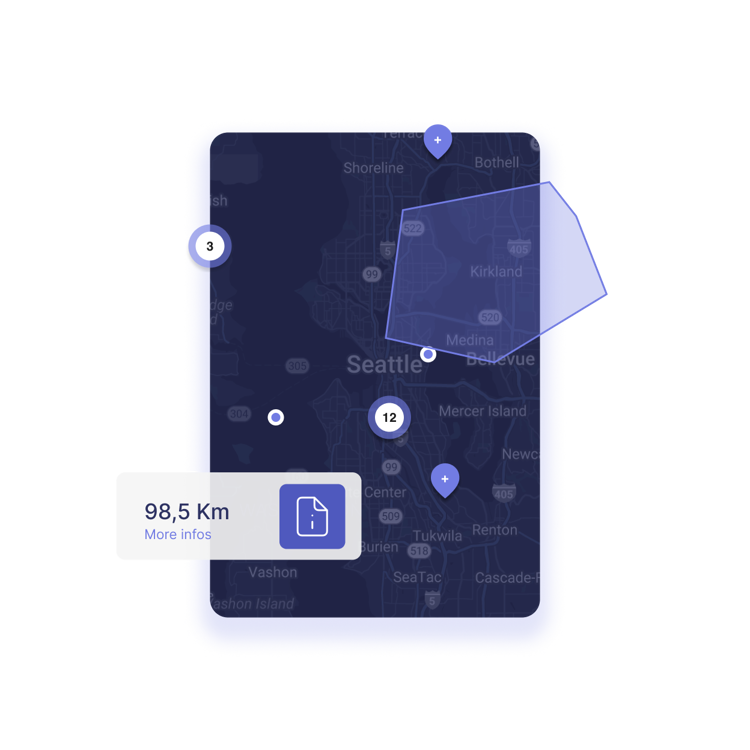
Interactive Maps: Geospatial Discoveries
Turn geographical data into interactive maps, making it easy to explore location-based trends.
Informative Tables: Data Clarity
Present data with clarity and precision using informative tables for in-depth analysis and comparisons.
Custom Visualization Solutions
Get tailor-made visualizations to meet your unique data presentation needs.
Our Case Studies
Discover how we transformed complex data into business success stories
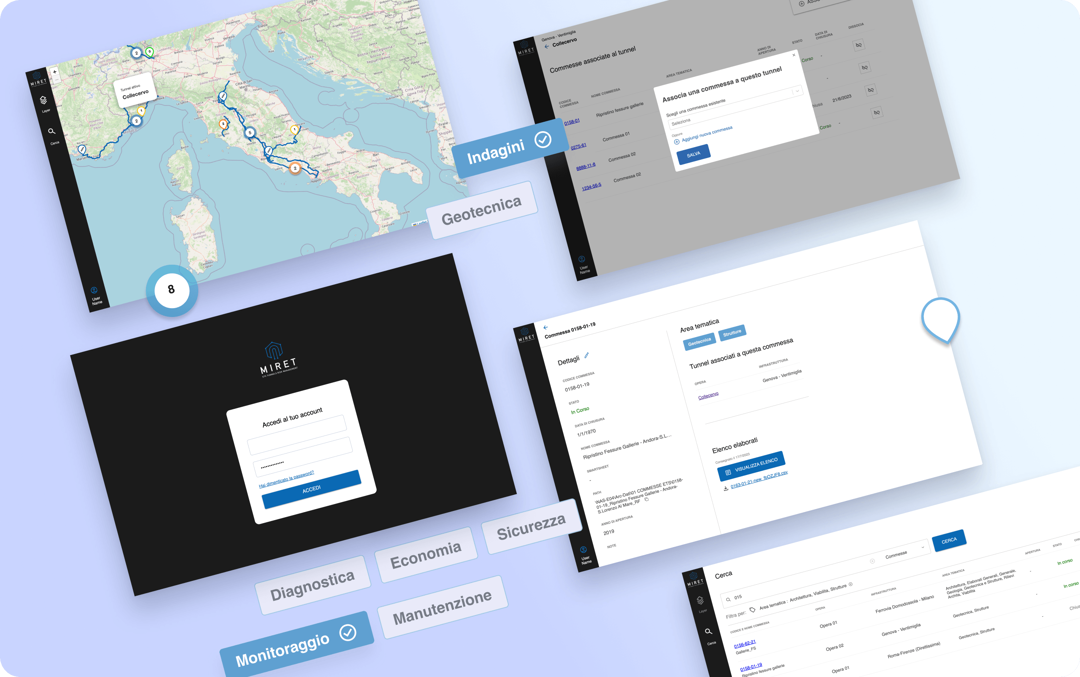
MIRETS | ETS
GS1 is a non-profit organisation that develops the most trusted standards for communication between businesses worldwide. In Italy, GS1 Italy gathers 40,000 active ventures in all of the main industry sectors.
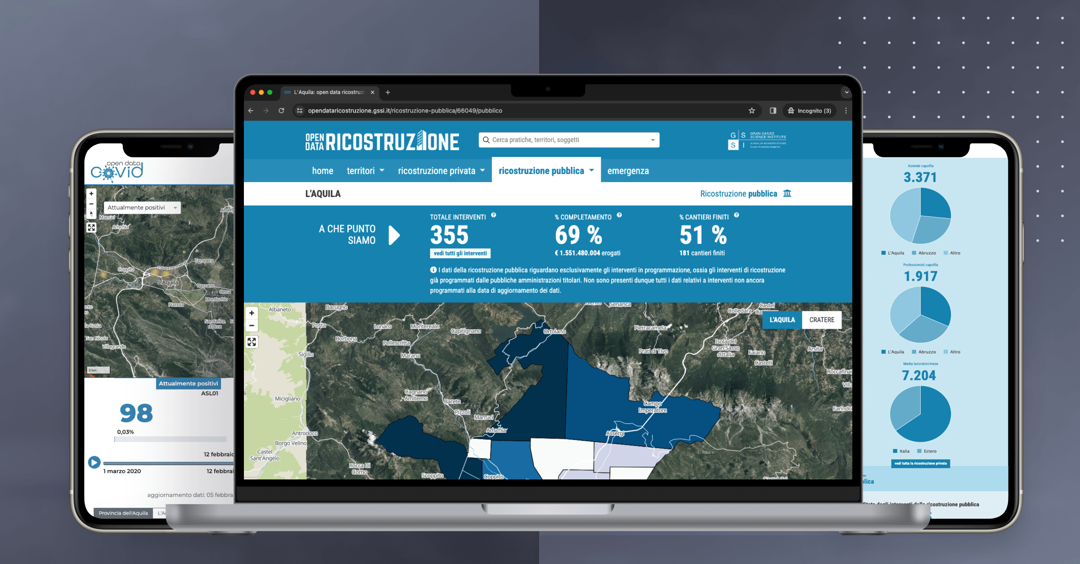
Open Data: maps and data to browse
Geographical maps, data visualization, features that help ETS operators work smoother and faster every day. Here's how 20tab got involved with MIRETS.
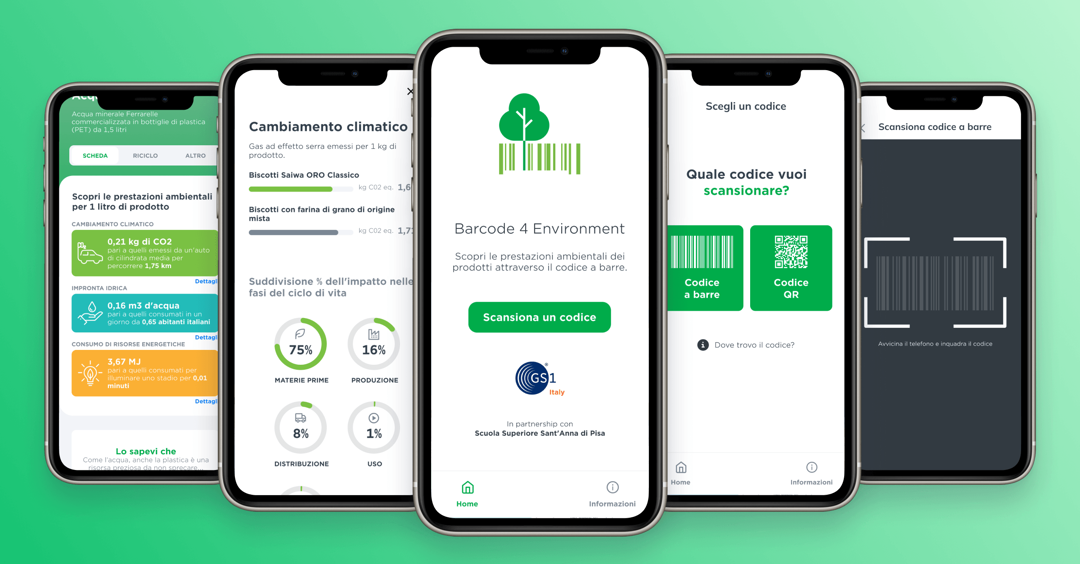
BC4E: a work on sustainability
GS1 is a non-profit organisation that develops the most trusted standards for communication between businesses worldwide. In Italy, GS1 Italy gathers 40,000 active ventures in all of the main industry sectors.
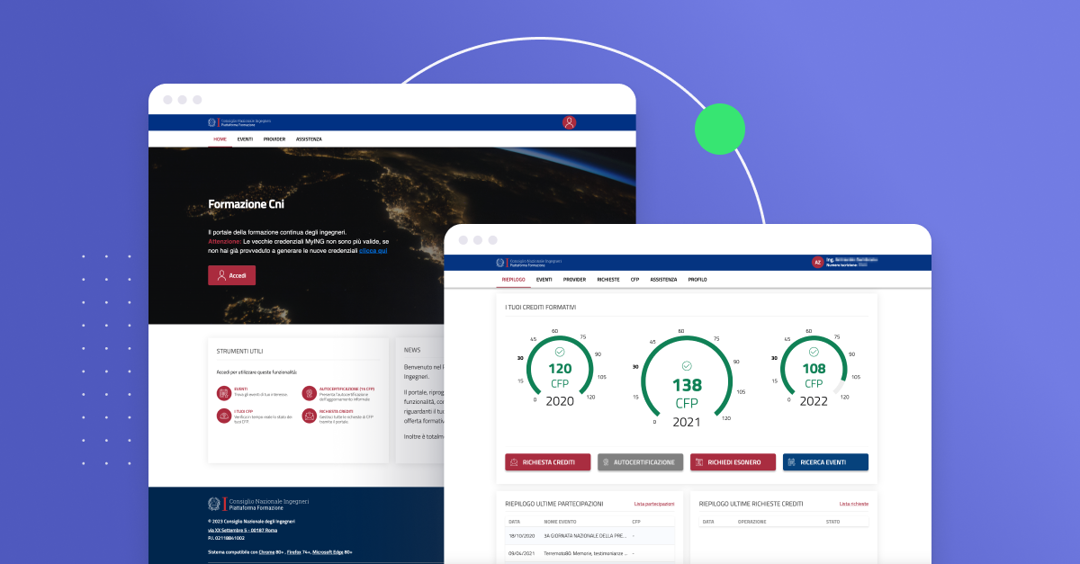
CNI: usability and digitalization
The platform was completely rewritten, within six months, and successfully published in a first version containing only the most important functions. New features and improvements have later been added on an ongoing basis to those already released, based on the feedback received.
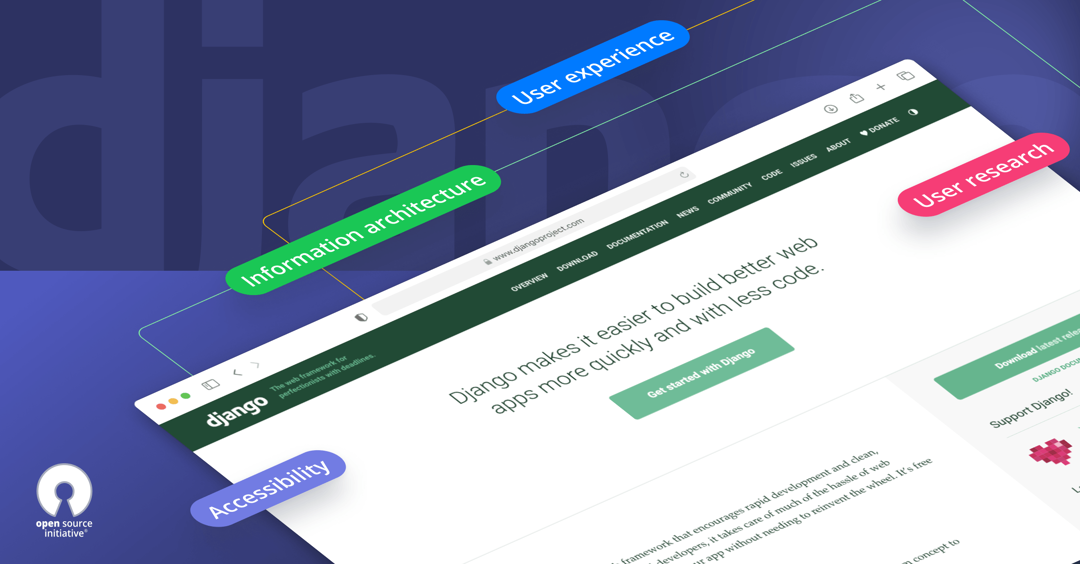
A new UX for the Django website
Django is the web framework, developed in Python. It is completely free and Open Source, with its continuous improvement driven by an active community of developers, including those at 20tab.
We are a digital product management and development company.
Our mission is to create products that have a tangible positive impact on users, businesses and communities, while minimizing the resources used.
Why people love us
With 20tab we have experienced the agile methodology with excellent results. Team skills, communication, special care for client needs, availability, are the aspects that had a bigger impact on us.
Federico Mittersteiner
GS1 Europe
With the 20tab team we have designed, developed and improved a platform necessary for our services. The top-notch expertise, the use of shared tools and the high human quality have led to an exceptional result.
Alessio Chiga
CNI
The specialists we have worked with proved to be fast, helpful and painstaking. Their expertise in information technology has been able to satisfy our requests, creating a product that perfectly reflects the mission of our organization.
Chiara Lorenzetti
PAVM
Looking for a Data Visualization Solution for Your Business?
Contact us now to schedule an appointment and discover how we can meet your needs!
